Geospatial Programming VIIRS
Visible Infrared Imager Radiometer Suite Fire Detection Script Tool
Visible Infrared Imager Radiometer Suite Fire Detection Script Tool
Problem
This project aims to visualize change detection of forest fire location on a global scale. It requires a satellite platform that covers the globe on a daily basis.
The Visible Infrared Imaging Radiometer Suite (VIIRS) sensor located on the Suomi-NPP satellite uses a moderate imaging spectroradiometer that provides imagery at 375m resolution.
While this may be considered coarse, it is perfect for capturing the entire globe in a short time span.
This script tool takes advantage of an algorithm that is based on NASA's MODIS Fire Detection suite.
This script collects data from the NOAA Satellite platform in a tab separated text file format.
Most importantly, it is updated in “near real time” or on a daily basis.
The text file format of this data makes it perfect to read and write using a python script. By taking fire detection information as a time series, we can detect when fires are forming, when they are extinguished, and we can identify areas where fires are more prevalent
Procedure
This script tool gathers tab separated data from an online database of Fire detection locations and writes the data to a text file.
It then converts the text files into point feature shapefiles. The shapefiles are filtered and symbolized using a layer template seen in the legend at the top of the page.
The shape files are then added to all the maps layouts that are seen in the results. Those map layout documents are exported as a GIF.
These GIFs are combined and placed in an html format for incorporating into a webpage.

Results
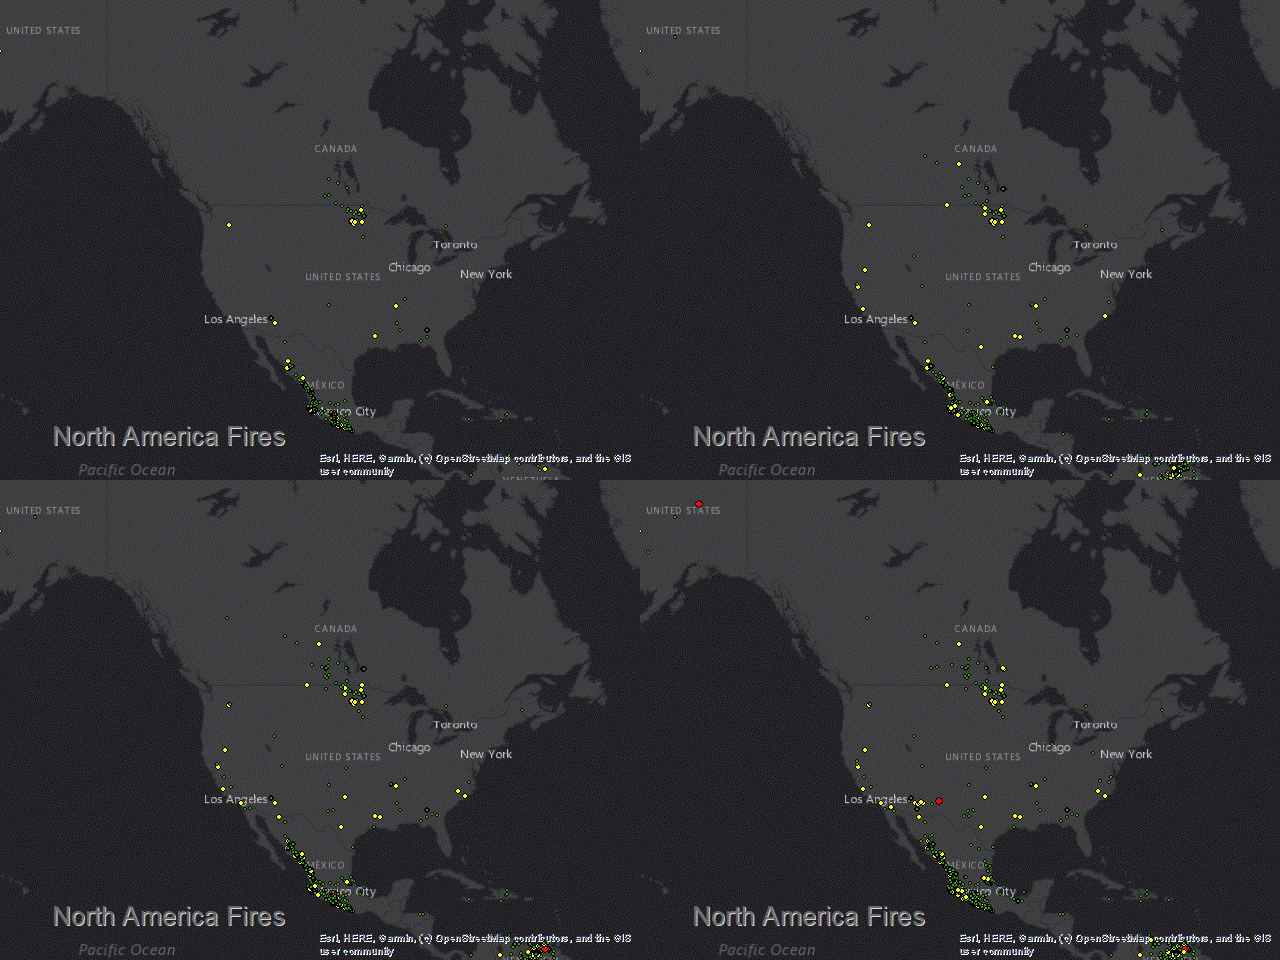
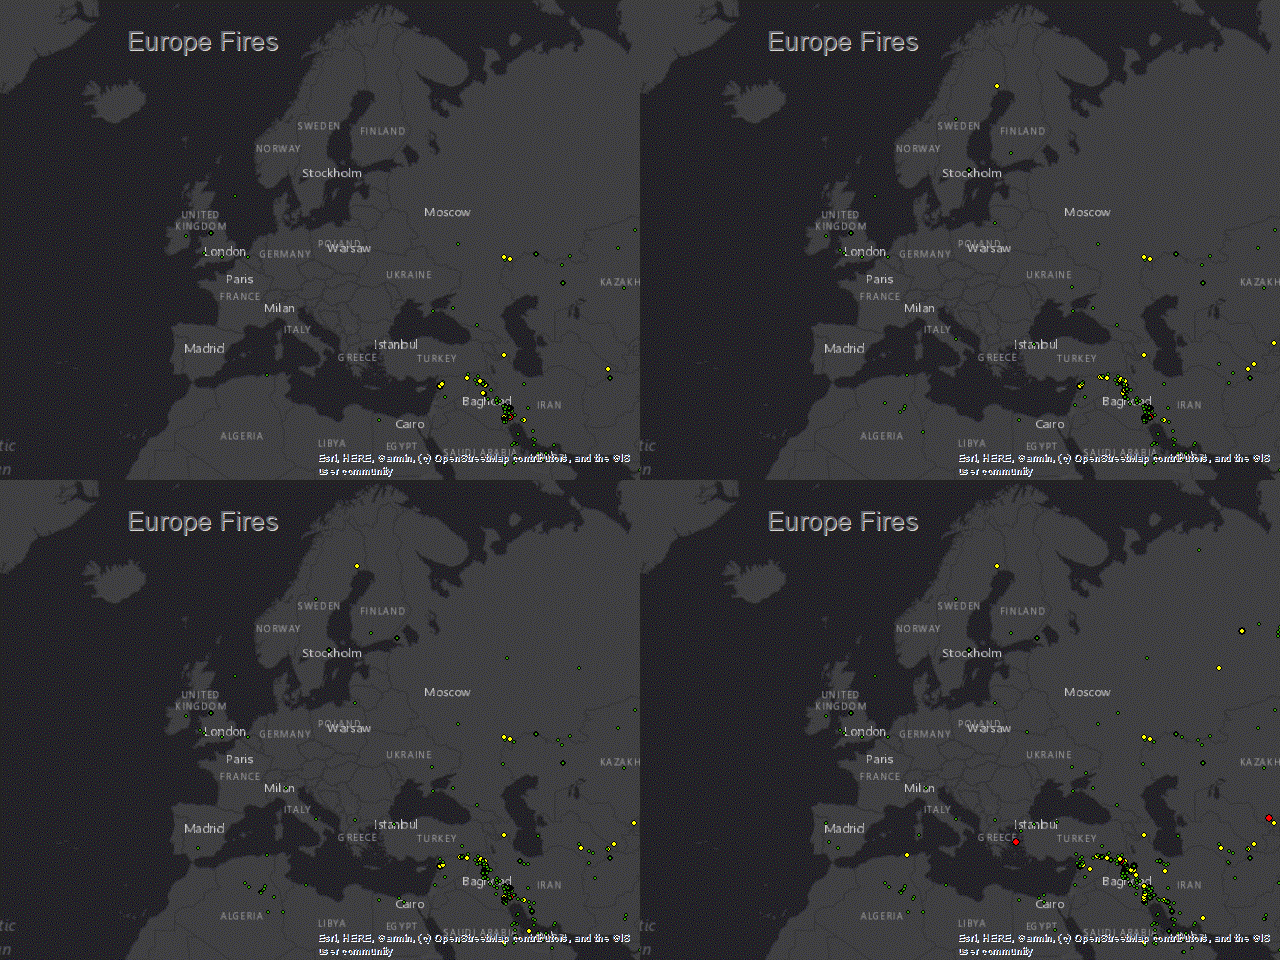
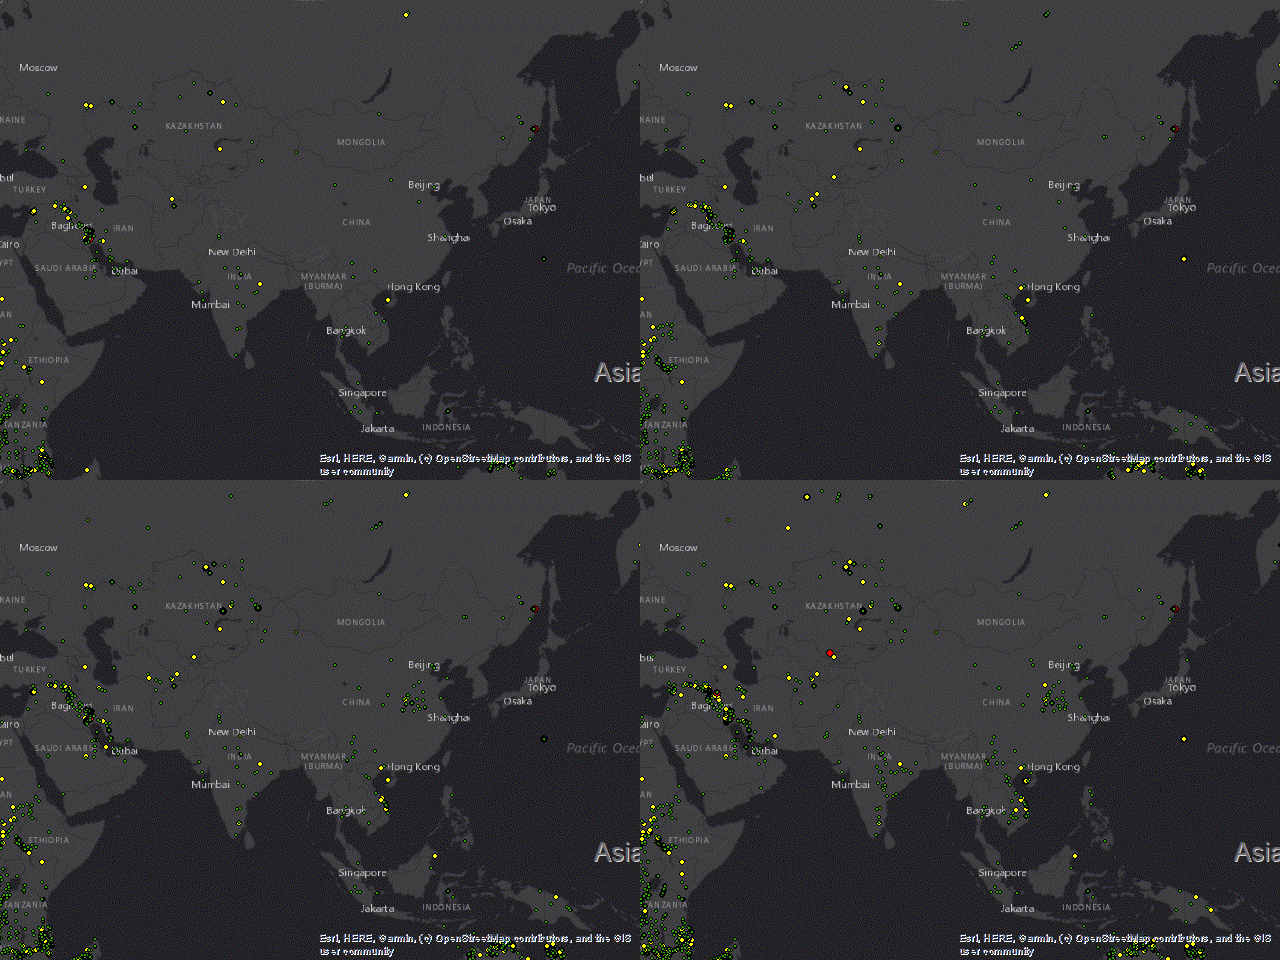
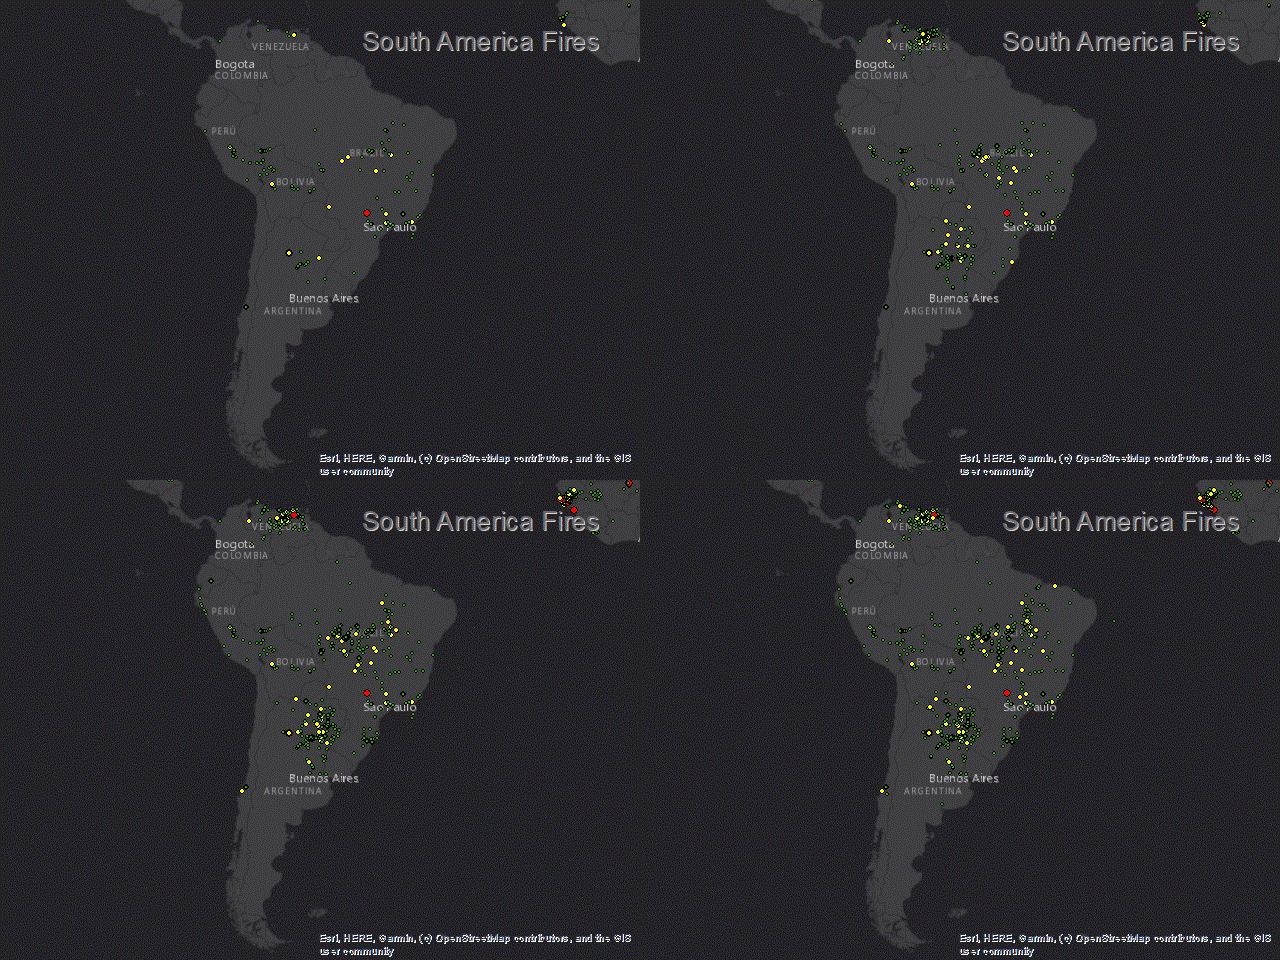
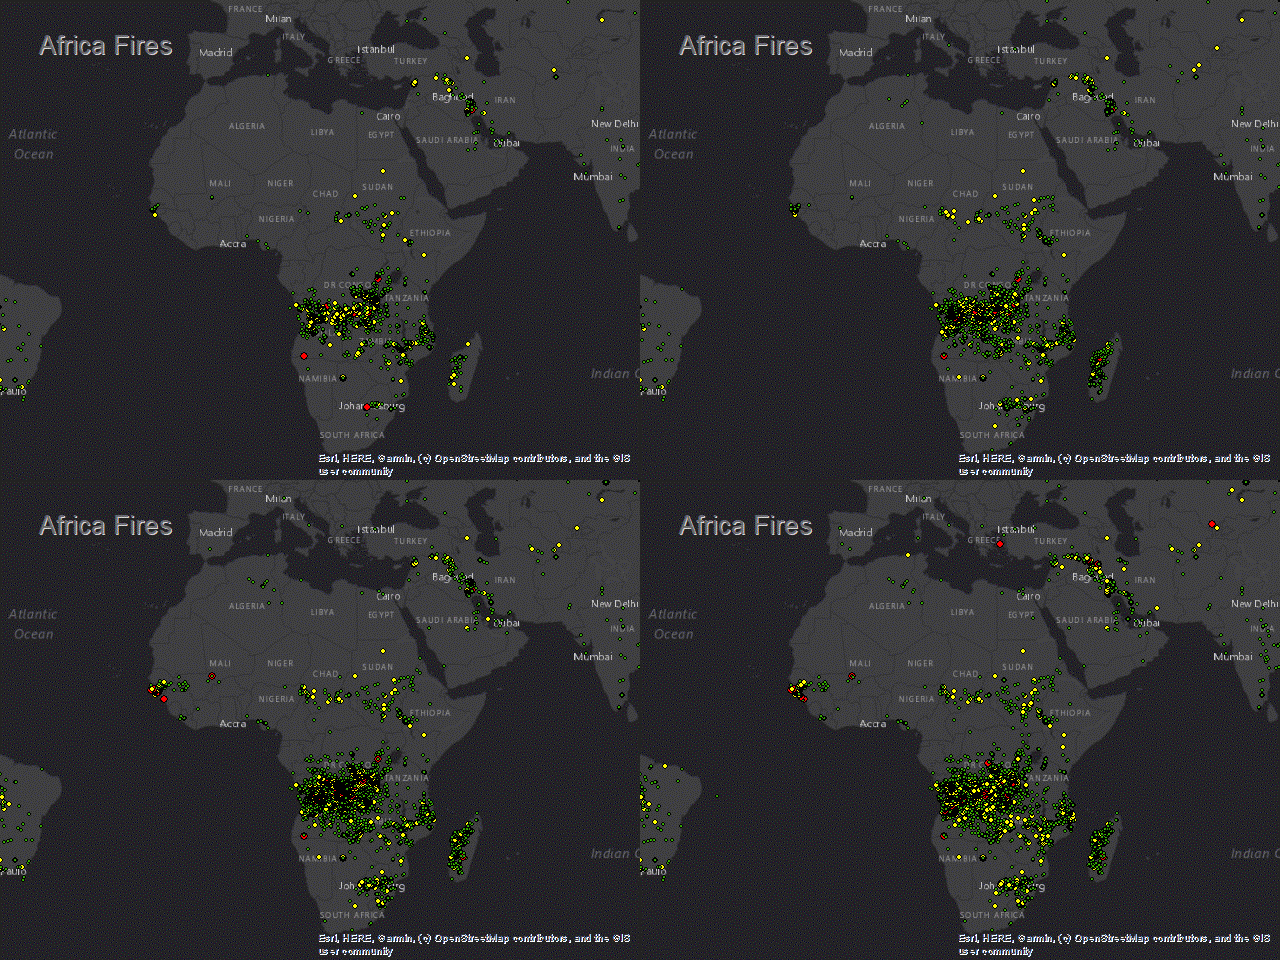
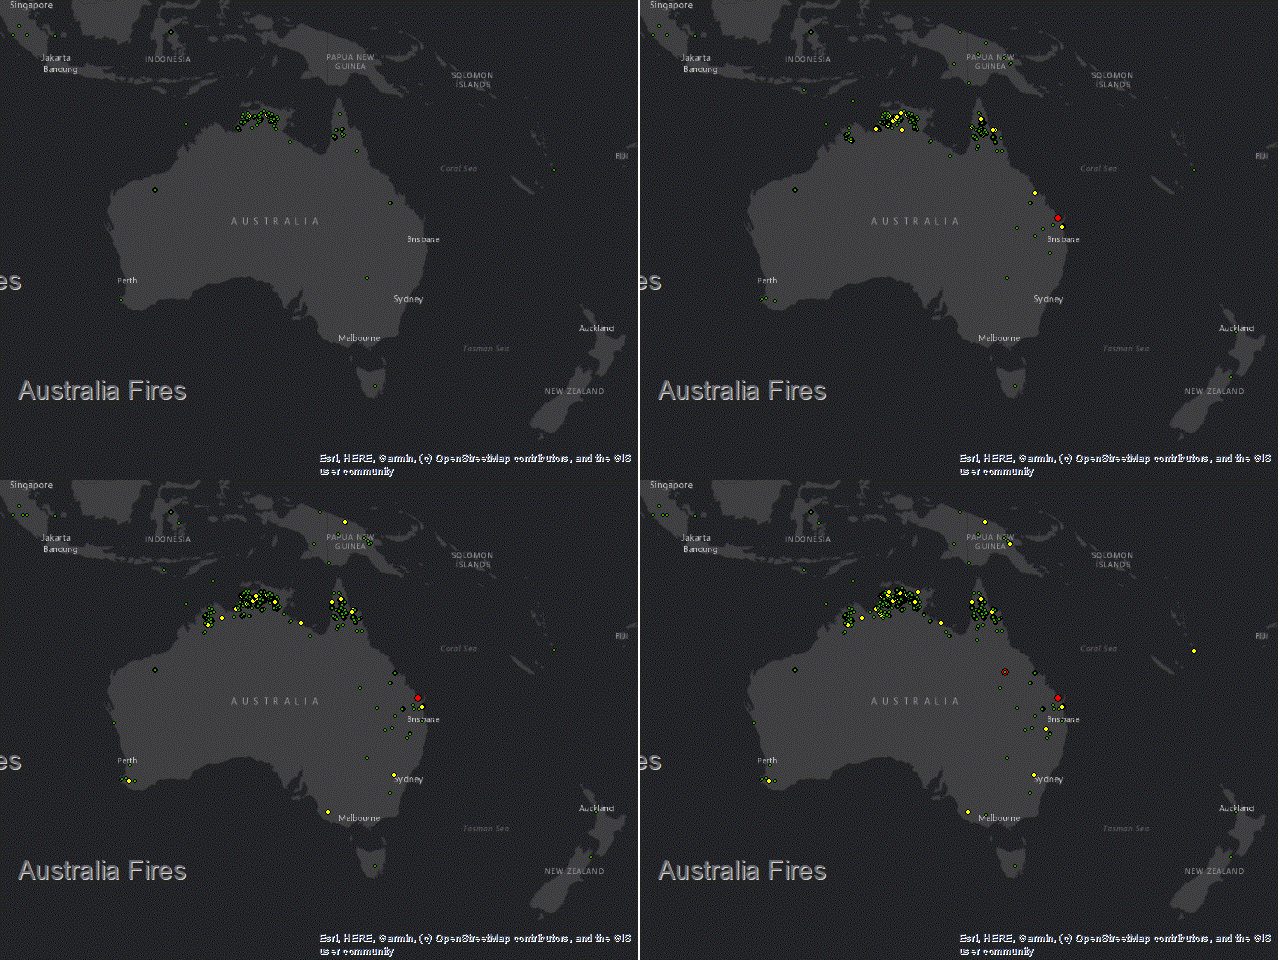
The results of running this tool come from creating 6 different map layouts for each continent on the planet, excluding antarctica.
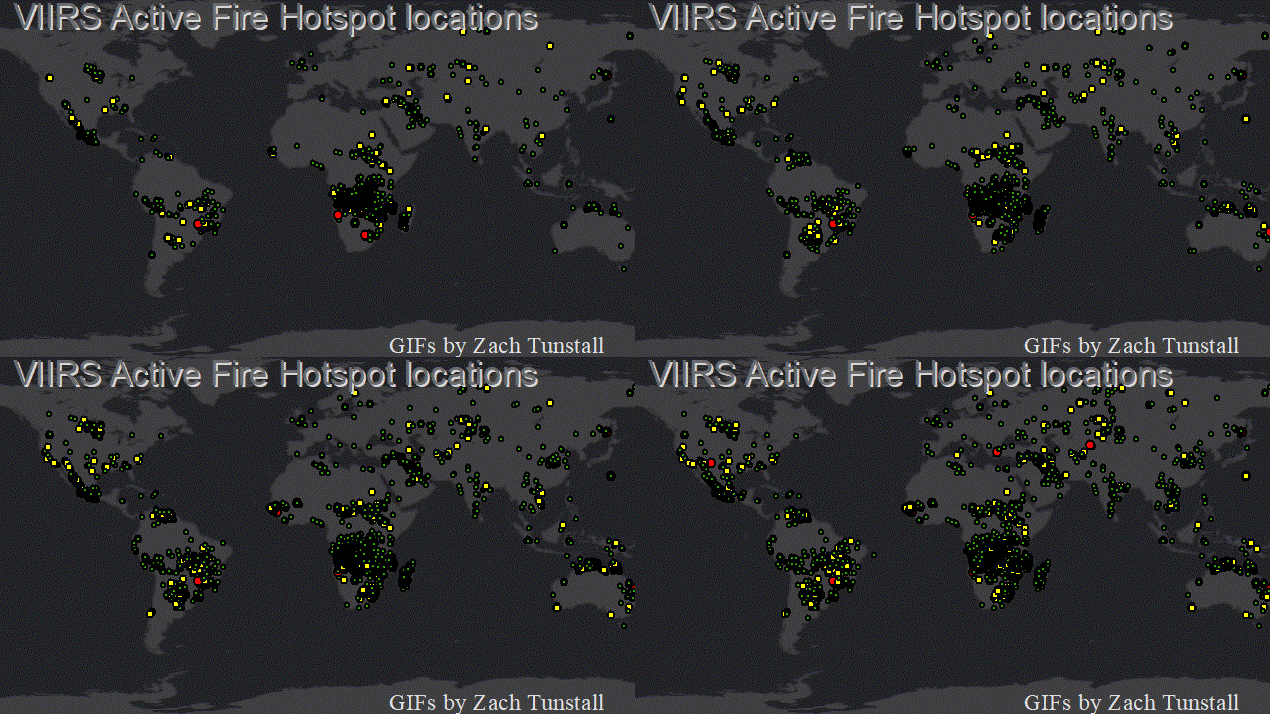
The results give a global perspective on just how many fires go on globally each day.
The locations of each detected fire are categorized into 3 categories that represent the heat intensity of each fire.
Red points are fires with over 100 megaWatts of intensity.
Yellow points are fires intensities between 50 and 200 megawatts.
Green points are fires with under 50 megaWatts of intensity.
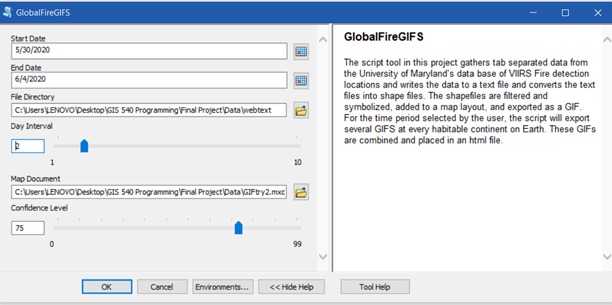
|
Parameter |
Explanation |
Data Type |
|
Start_Date |
Select a Date that is after Febuary 4, 2020 (Data is unavailable before this date). |
Date |
|
End_Date |
Data is typically not available within 24 hours of the current date. |
Date |
|
File_Directory |
Parameter is set by default environment |
Folder |
|
Day_Interval |
Number of days to skip over. |
Long |
|
Map_Document |
Use the Default setting. |
ArcMap Document |
|
Confidence_Level |
The probability that the sensor and algorithm returned an accurate reading. |
Long |
Reflection
This script tool was written using the IDE Pythonwin2.8 using the programing language Python2.8.
Today this is considered an outdated version of the language. Working with Python2.8 helped to understand geospatial programming standards at a fundamental level.
This was my first script that incorporated multiple coding elements such as debugging, modules, cursors, and batch processing.
From this project, I learned the importance of code structure.
This has been critical to understand the basis for many different programming languages.
Continental map views of world fires
Detected between Jul 30, 2020 to June 04, 2020 using a 2 day interval with 75% confidence
