Capstone Project Citrus Greening
Tree Detection and Disease Tracking

Tree Detection and Disease Tracking

Problem
The goal of this project is to document a historical timeline of the presence of a tree disease affecting citrus plants.
In order to create this timeline remotely sensed imagery from the past 50 years will be collected and spatially referenced to the study area.
The work of this project is to assist in creating a historical timeline of each individual tree on this farm and create tabular data to display whether or not each tree was alive during each aerial image used in the project.
Procedure
The procedure used to create this model consisted of several stages, starting with data collection.
Aerial imagery was found using open-source government owned platforms.
The government agencies used were the Florida DOT, USGS, and USDA National Agriculture Imagery Program.
The images were then organized and given new file names to match naming conventions for ESRI time-enabled data schema.
Vector data was created using CAD features within the ArcGIS Pro software.
Trees were marked using coordinates for the first planting in each row and using a spacing of 10 feet between citrus trees.
The next critical step in crating the geoprocessing model for this project was to establish a vegetation index that is suitable for the aerial images collected.
Since the imagery available only contained red, green, and blue bands, the commonly used indices, such as NDVI, were not applicable.
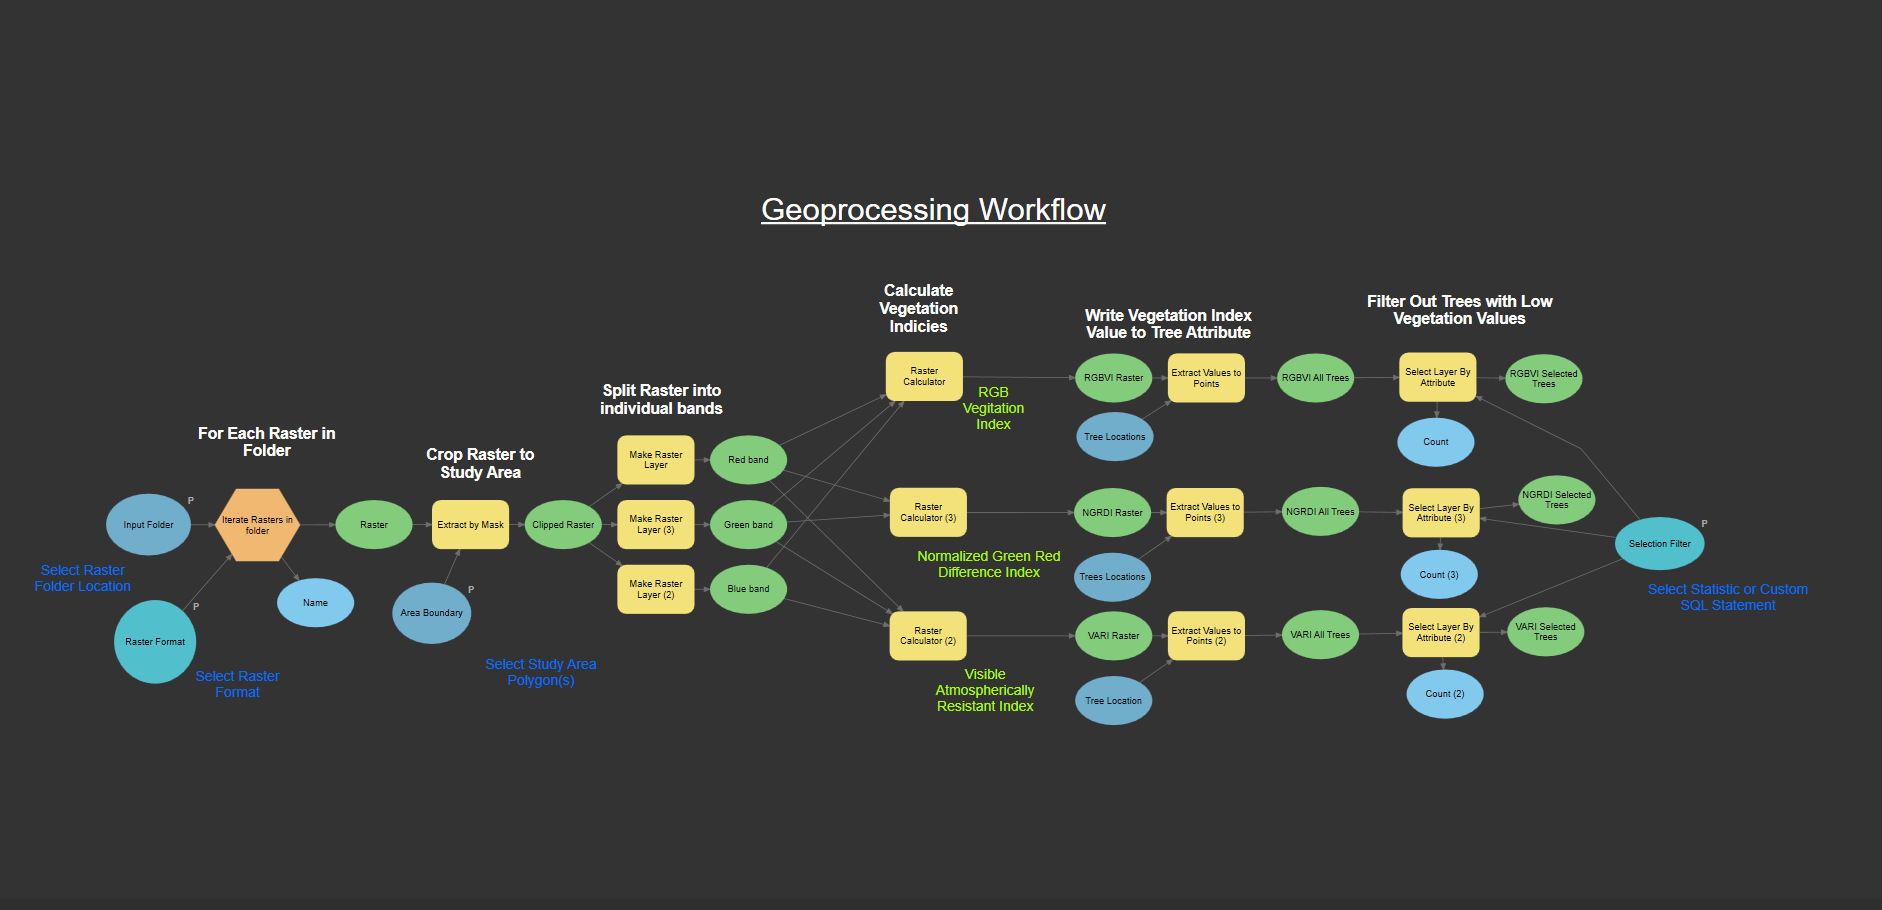
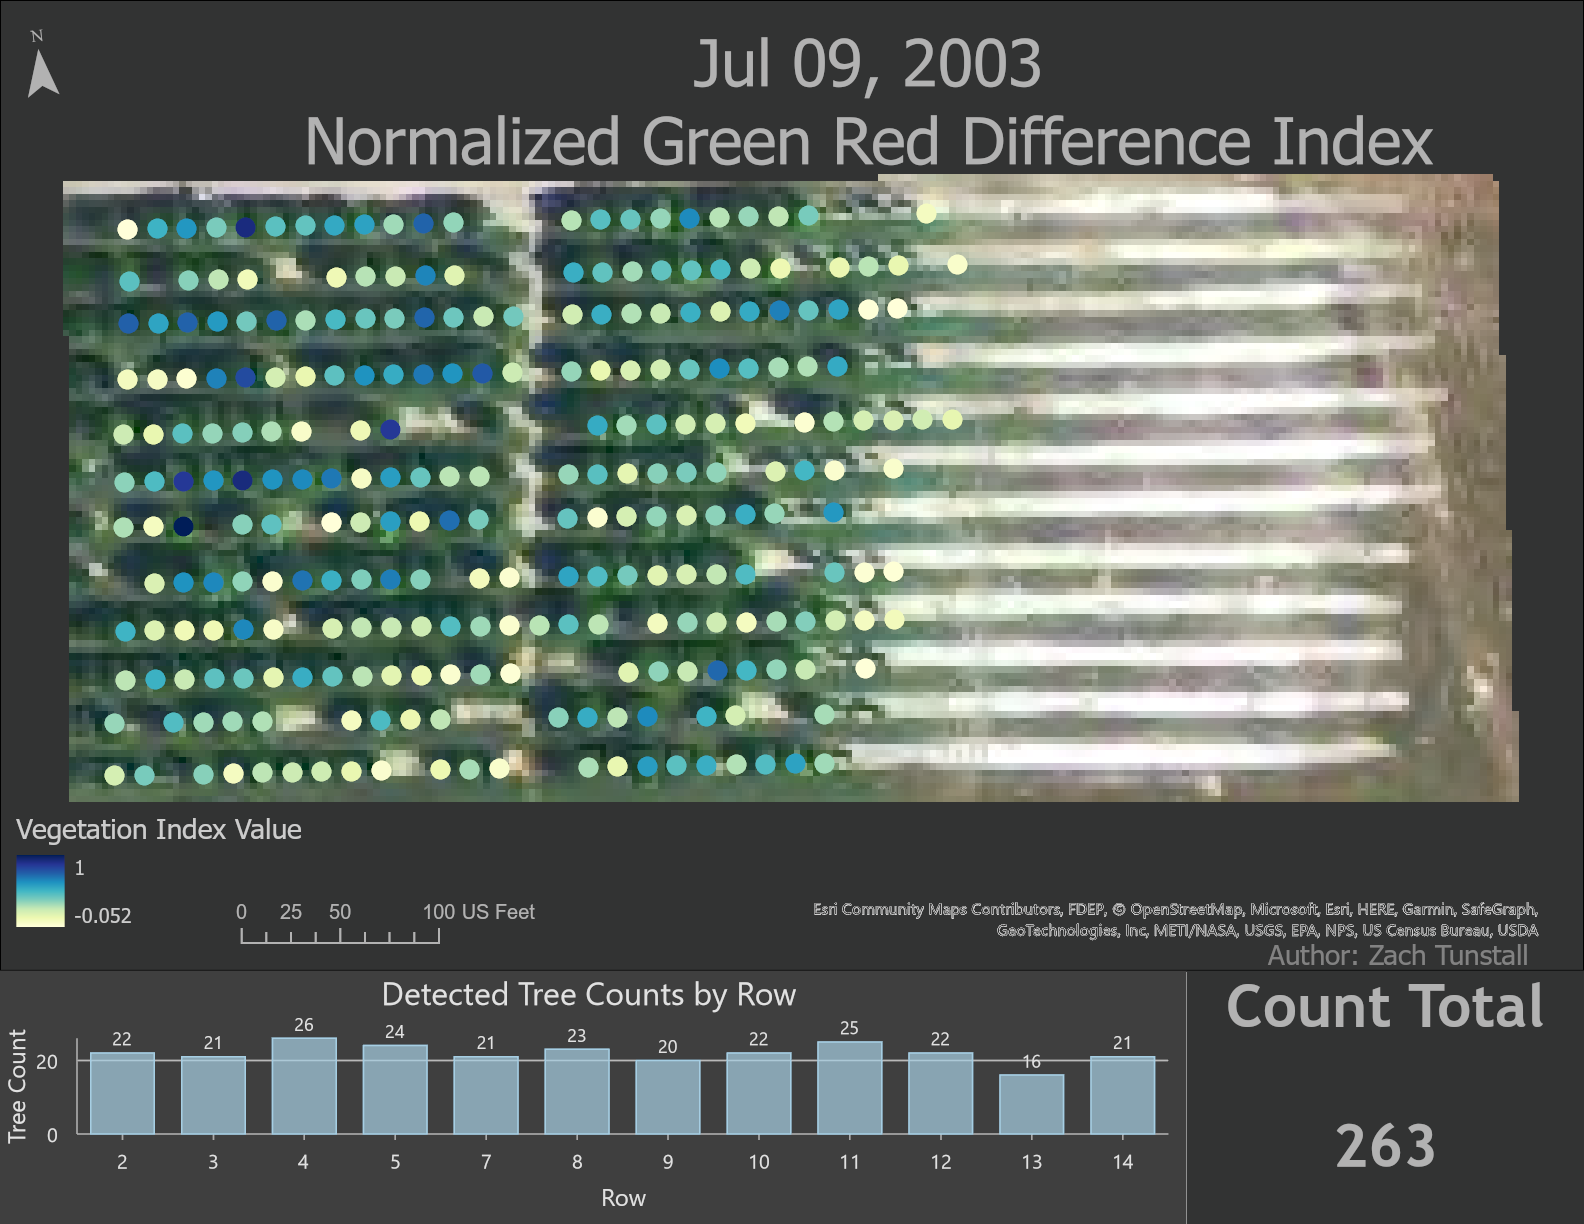
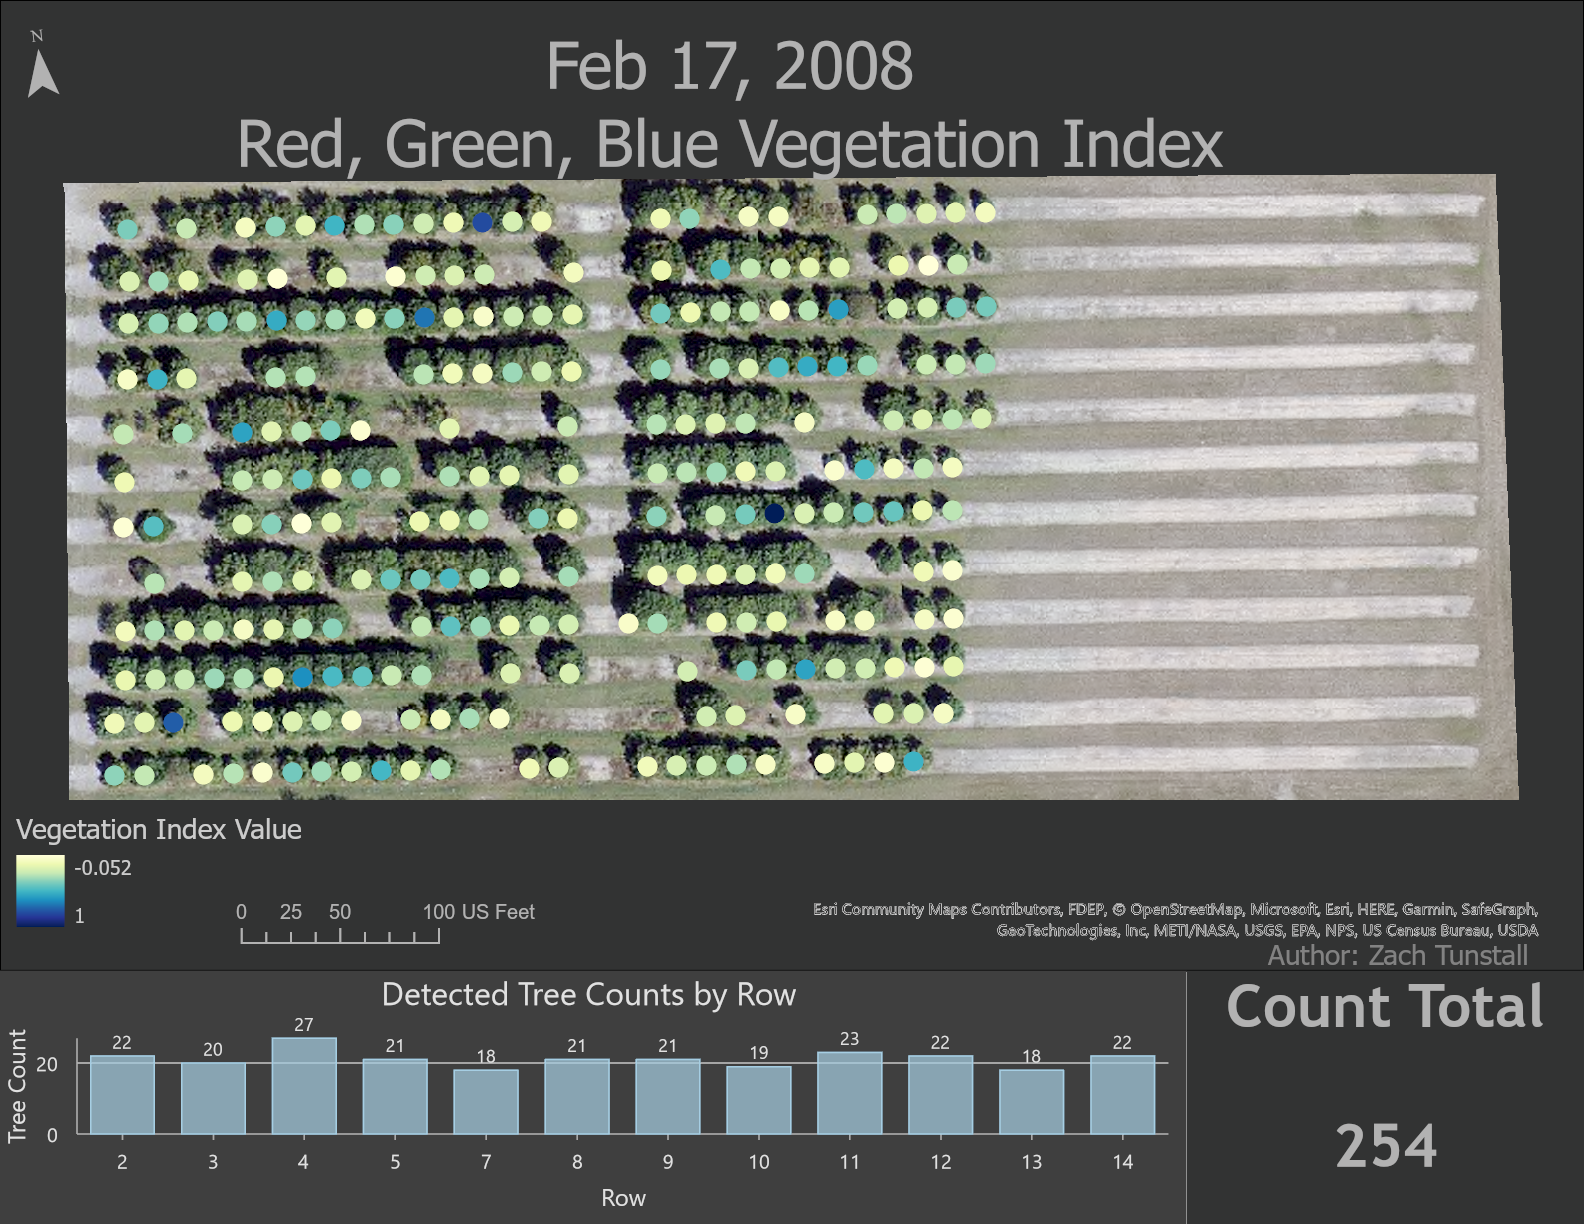
The vegetation indices that were used in this project were Visible Atmospherically Resistant Index, Normalized Green Red Difference Index, and the Red, Green, Blue Vegetation Index.
These formulas were selected because of their accuracy and calculated RMS error margins were close in range to that of NDVI.
The formulas for these vegetation indices are:

All three of these indices were calculated over the study area and a best choice for each image was selected based on visually determined accuracy of the results.
A threshold value was then set based on the average value calculated for each raster layer created from the calculation of each index.
The raster values from the calculated indices were joined to the tabular tree data and a new feature class was created for each aerial image and for each vegetation index.
These results were joined to one feature class to create a timeline table.
This table uses the threshold set in each raster calculation to determine whether or not a location has a live tree or not.
This table yields the timeline of existence for each citrus tree in the study area along with the associated vegetation index value.
The geoprocessing model for this project was created in ArcGIS Pro Model builder.

Results
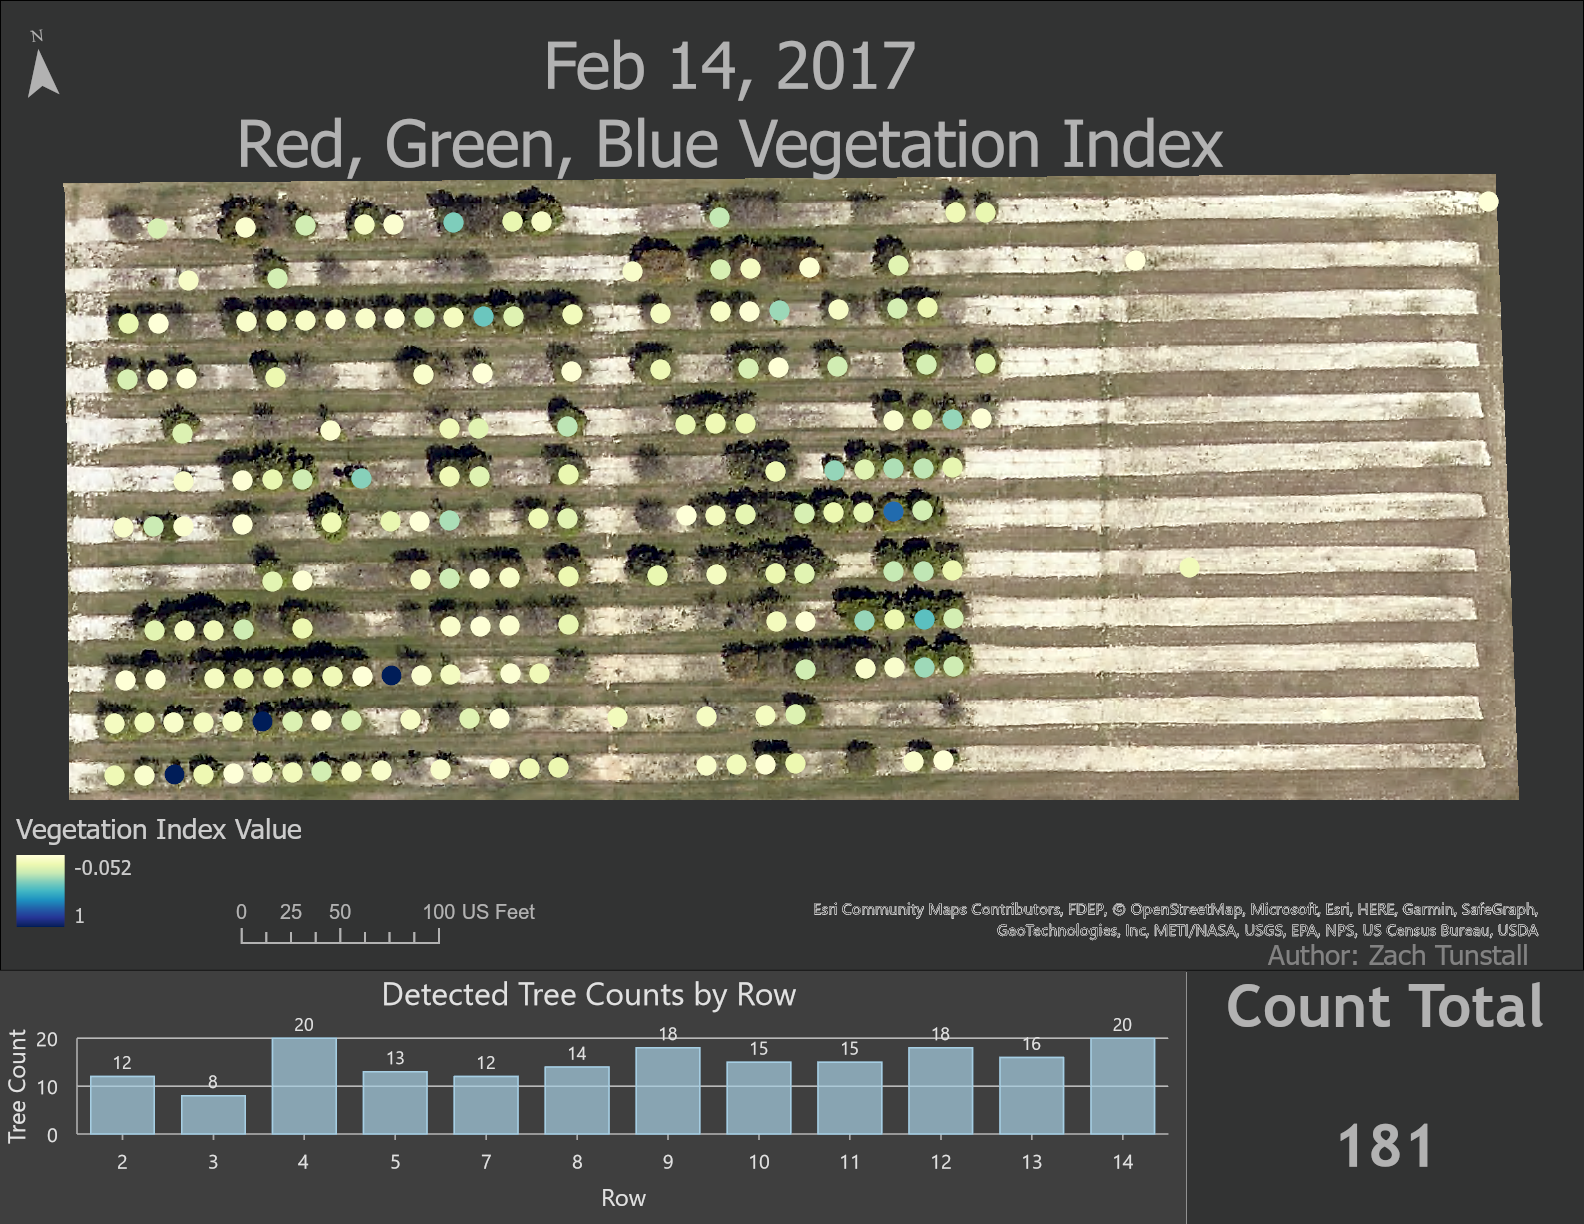
The results gathered from current iterations of the geoprocessing model shows a significant reduction in in living citrus trees starting sometime between 2006 and 2008.
This decline in tree numbers and tree health continues and is visually observed through every subsequent aerial image.
However, the results of the model in more recent years do not correlate with visual observations in the images.
There are several speculative reasons for this large shift in data accuracy as discussed in the Discussion section.


Discussion
The first attempted method of solving this spatial problem was to train a machine learning classifier to detect individual citrus trees.
This is a modern way at finding a solution to finding and classifying individual trees. However, the method is time consuming due to the need to train a new model for each image, and that early results yielded wildly inaccurate results.
Upon running several iterations of the model, it was determined that results in the later years of the study returned highly inaccurate results when compared with the rest of the datasets.
Potential reasons for inaccuracy in results in the later years of the study … First, changes and upgrades in sensors used in the aerial images.
Higher resolution may cause the model to pick up on parts of the tree with low vegetation causing the associated tree to fall below the threshold.
Issues were found in the ArcGIS Pro 3.0 software when creating time-enabled raster mosaics.
Creating these types of mosaic raster data sets caused paths to data sources to break without reason and not allow source paths to be repaired.
This also made creating an image service that included all raster images to fail when added to a hosted server environment.
Future Research
The current state of the geoprocessing model only takes values from a point location.
The team has attempted several ways to try and circumvent errors in this method of tree detection.
One way was to calculate total tree canopy in each raster image by categorizing the raster output from calculating the various vegetation indices.
We would then count the pixels from the categories that correlate with tree canopy and convert the pixel count to area.
This method can be seen the current version of the web mapping application associated with this project.
The current and best solution to deal with inaccuracies in the model results is to create a three-to-five-foot buffer around each tree point location and join raster values to polygons rather than to point data.
Then a threshold would need to be determined for each image.
This could be determined by the user and the model could be refined until accuracy is strengthened.
Conclusion
The geoprocessing techniques and methods presented in this project demonstrate the ability to detect citrus trees based on vegetation indices without a near infrared band with moderate accuracy.
While the current method is ready to scale up to a larger study area, further work on the geoprocessing model is needed to be done before any conclusive results can be assembled from the given data.
Once this work is completed, the model will be passed on to the USDA-ARS researchers as a custom geoprocessing tool for them to use in other locations at larger scales.
